Why Choose TFS Aerial Solutions?
Precision drone mapping and monitoring built specifically for Malaysian palm oil estates. We don't just fly drones — we deliver decisions.
Palm Oil Specialists, Not Generalists
We don't do weddings, events, or construction. Every workflow, deliverable, and analysis we build is purpose-made for Malaysian palm estates. You get a team that speaks your language — FFB, Ganoderma, block prescriptions, MPOB.
CAAM Licensed — Fly Legally, Everywhere
Operating with an unlicensed contractor puts your estate at regulatory risk. TFS holds a valid CAAM drone operator certificate, covering liability and legal compliance on every flight.
Decisions, Not Just Data
We don't hand you a folder of raw images and call it done. Every survey produces prescription maps, problem-zone alerts, and actionable recommendations — so your team knows exactly where to go and what to do.
Everything in One Package
High-resolution aerial map, canopy health assessment, 3D estate view, and a full written report — all from a single survey flight. No outsourcing, no hidden add-ons.
Your Data, Forever
All survey outputs — maps, reports, 3D models — are stored in your secure client portal and available to download anytime. You own your data. No subscription required to access it.
Local Team, Malaysian Terrain
We understand Malaysian estate conditions — monsoon seasons, steep terrain, access roads, MPOB compliance requirements. No adaptation needed; we're built for this environment.
Malaysia’s Plantations Are Aging. The Window to Act Is Now.
Malaysia is the world's second largest palm oil producer. Together with Indonesia, both nations supply 85% of global palm oil. But underneath that dominance is a structural challenge most estate managers already know firsthand: the trees are getting old.
Oil palm trees over 19 years old produce significantly less than younger stands. And with replanting taking 2–3 years before new palms bear fruit, there is no quick fix. The estates that perform during this window will be the ones that managed their existing trees precisely — not the ones that flew blind.
At current CPO prices, every tonne of avoidable yield loss is money left in the field. Ganoderma spreading undetected block to block. Waterlogging draining nutrition from soil. Weed pressure competing with palms for fertiliser that costs hundreds of ringgit per acre per year.
TFS quarterly monitoring identifies exactly where that loss is happening — block by block, quarter by quarter — before it compounds.
Malaysia’s plantation sector faces a structural labor shortage. Precision monitoring tells your ground team exactly where to go — maximizing the impact of every working hour rather than spreading effort across the entire estate.
With CPO prices at multi-year highs, every tonne of preventable yield loss carries a higher cost than ever. The ROI on early detection scales with the price of the commodity.
The Challenge
Most palm oil estates make critical management decisions — replanting, fertiliser allocation, pest control, drainage — based on incomplete data or manual ground observation. Satellite imagery is too coarse. Manual inspection is too slow and subjective. The result: wasted inputs, missed disease outbreaks, and yield losses that compound year after year. TFS exists to close that gap with precise, actionable aerial intelligence.
Our Process
Consultation
We assess your estate, terrain, and management objectives. You receive a detailed quote within 24 hours.
Flight Planning
We plan the optimal flight coverage for your estate, accounting for layout, terrain, and any site-specific requirements.
Drone Survey
Our drone systematically surveys your estate from above, capturing detailed aerial imagery of every block. Typically completed in 1–3 hours on-site.
Data Processing
Hundreds of aerial images are processed into a detailed map of your estate, including terrain and elevation data.
Analysis
Our team analyses the aerial map: palm health classification, waterlogging detection, tree count, drainage assessment, and recommended action zones.
Delivery
Complete report package delivered via the TFS client portal. Maps, shapefiles, GPX waypoints, and actionable recommendations.
What We Detect
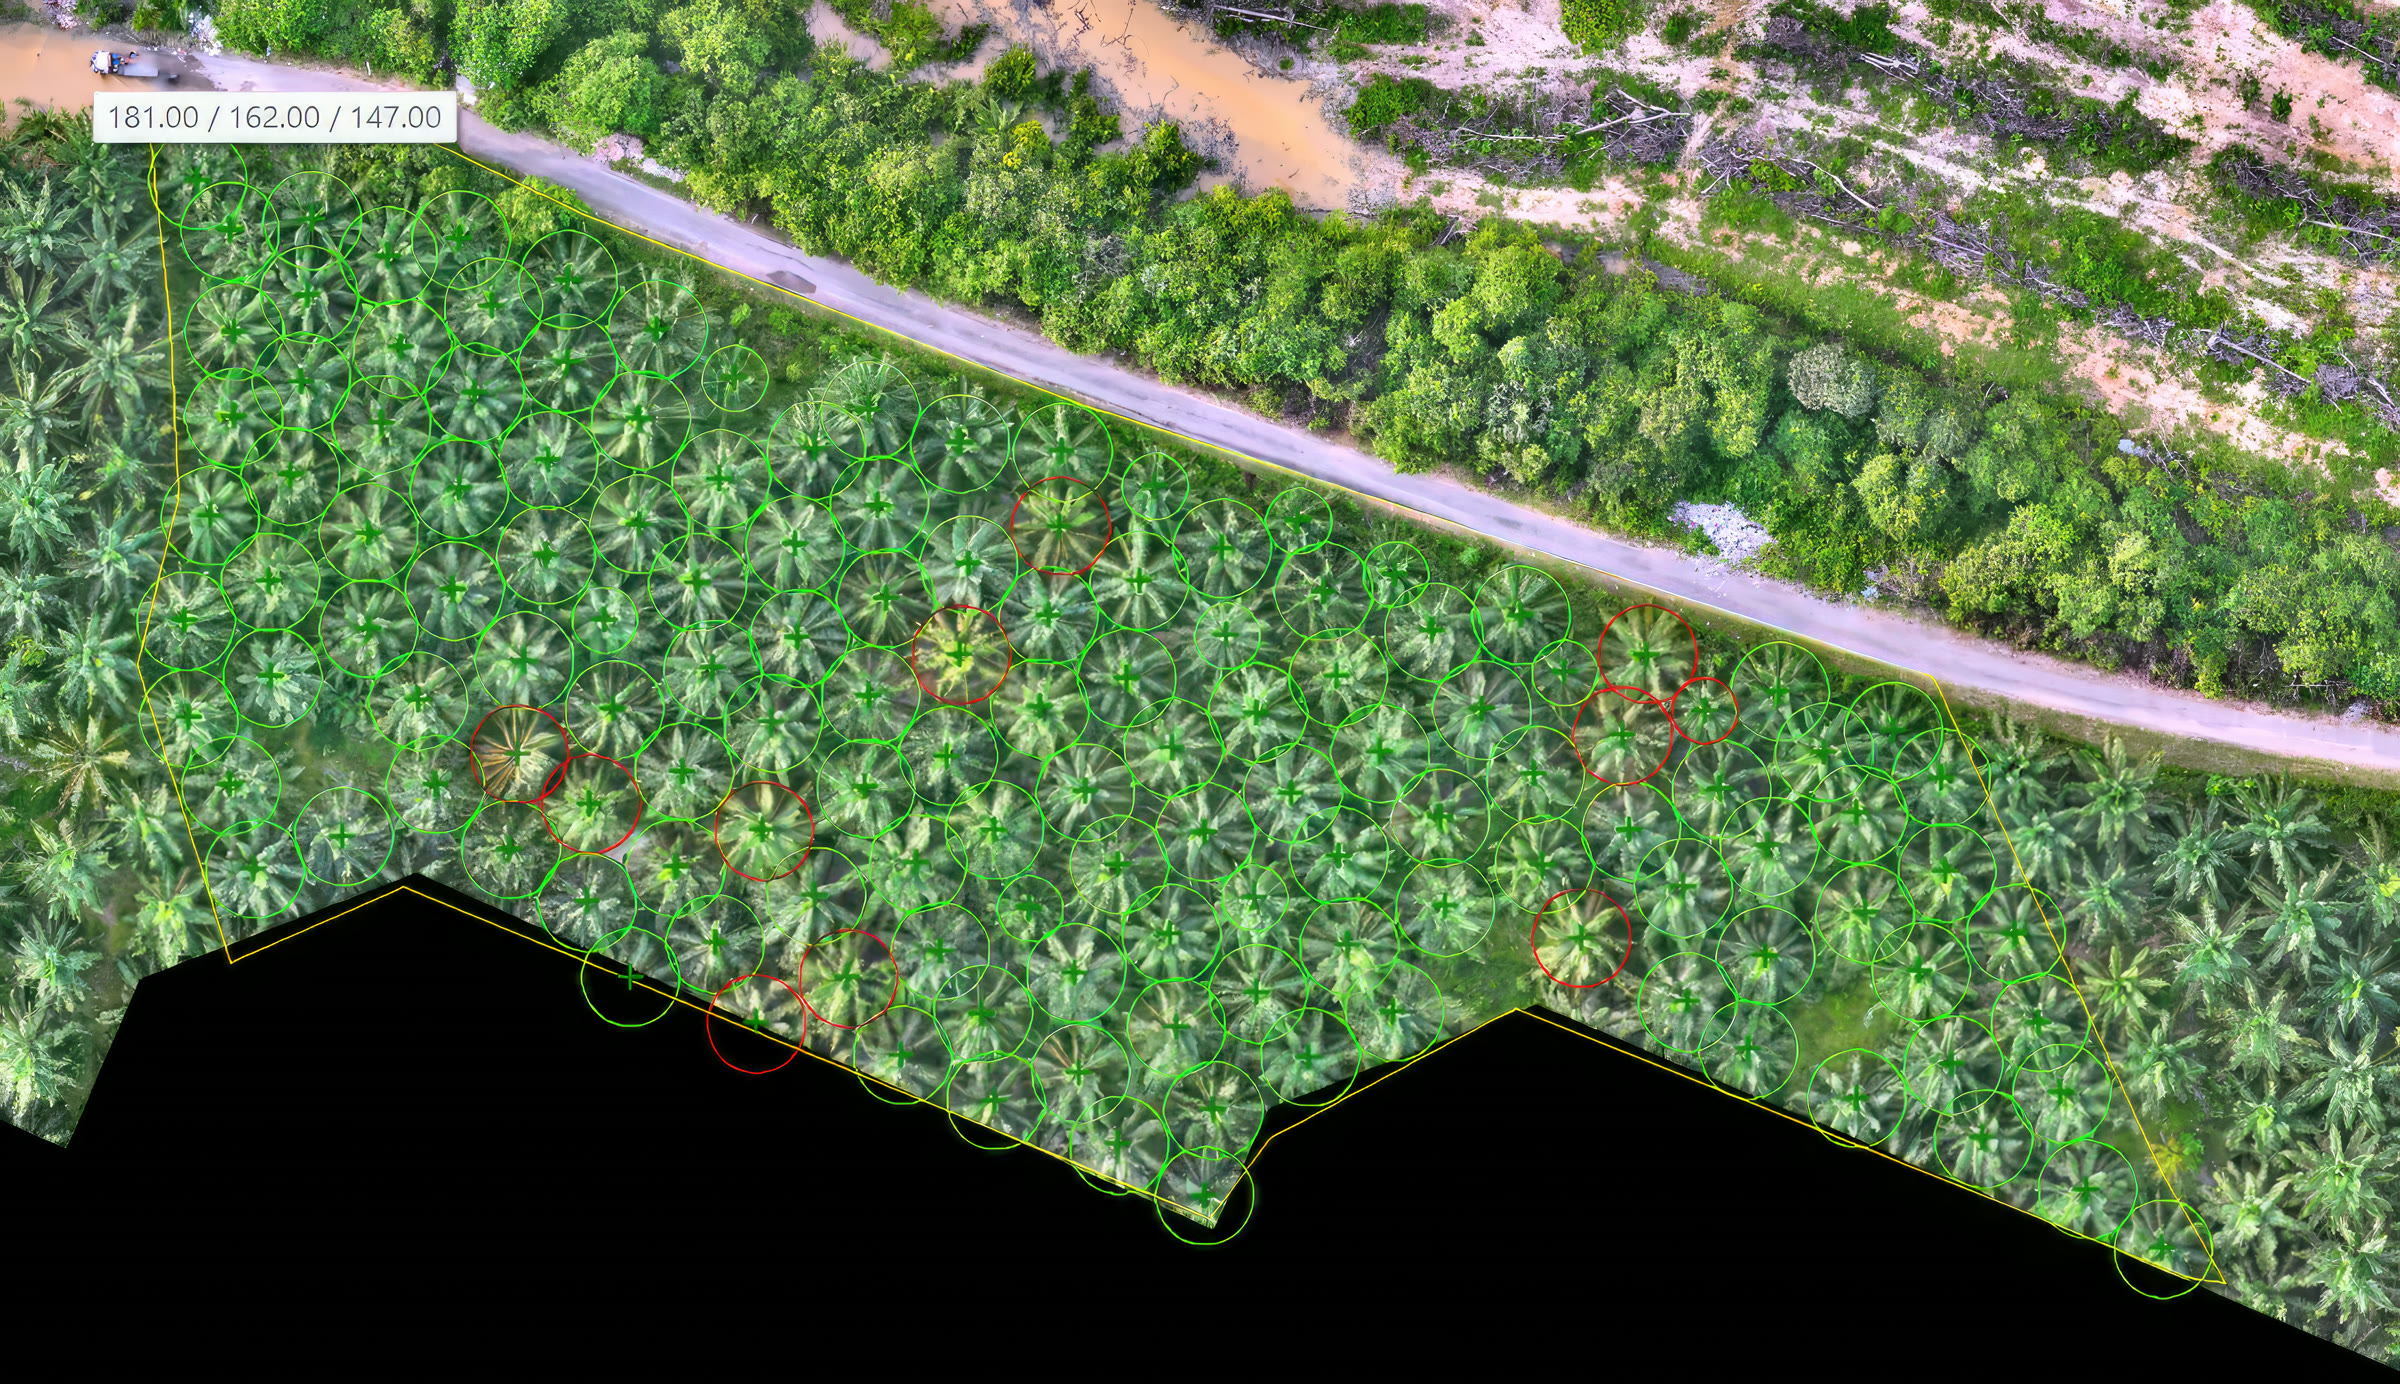
Palm Health Classification
5-tier health scoring from vigorous to critical. Identifies stress patterns invisible from the ground. Enables targeted intervention before yield loss.
Ganoderma / Basal Stem Rot
Flags palms showing canopy stress patterns that may indicate disease. Maps affected areas by block for priority ground inspection. Supports early intervention planning before spread.
Learn more →Waterlogging Detection
Terrain model reveals standing water and drainage failure zones. Identifies palms at risk of root asphyxiation and yield decline.
Drainage Network Mapping
Complete drain network assessment: blocked, silted, functional. Prioritises maintenance to prevent waterlogging damage.
Pest & Defoliation
Detects palms showing stress through changes in leaf colour and canopy shape. Maps affected zones for targeted ground investigation and intervention.
Nutrient Deficiency Indicators
Visual signatures of nitrogen, magnesium, potassium, and boron deficiency. Informs precision fertiliser application zones.
Boundary, Inventory & Infrastructure
Tree-level precision boundary files for MSPO/RSPO/EUDR certification. Accurate palm count, road network, and infrastructure mapping.
Learn more →See the Difference
Real before-and-after outputs from TFS surveys — raw aerial imagery transformed into actionable intelligence.
 After
After Before
Tree Count Detection
Raw canopy aerial vs. automated per-palm detection with yield estimation
 After
After Before
Weed Pressure Mapping
Standard aerial vs. classified weed pressure zones with treatment priority
 After
After Before
Road Condition Assessment
Plantation road network before and after maintenance intervention
Research & Evidence
Malaysian palm oil yield gap below theoretical maximum
Of mature replanting stands affected by Ganoderma
Fertiliser waste reduction with aerial monitoring
Annual economic loss from Ganoderma in Malaysia
Quarterly site visits — timed to plantation management cycles
Of global palm oil supplied by Malaysia + Indonesia
High-resolution images captured on a 500-acre estate
Automated palm detection accuracy from aerial imagery
TFS vs. The Alternatives
| Factor | TFS Drone | Satellite | Manual | No Monitoring |
|---|---|---|---|---|
| Resolution | Individual palm | 30–50 cm | N/A | N/A |
| Positional Accuracy | Centimetre-level | ±1–5 m | Varies | N/A |
| Turnaround | 5–7 days | 2–4 weeks | 1–2 weeks | N/A |
| Cloud Dependency | Flies under clouds | Blocked | Not affected | N/A |
| Tree-Level Detail | Yes — individual palms | No | Yes but slow | No |
| Cost Per Acre | RM 20–40/acre | RM 5–15 | RM 50–100+ | RM 0 (hidden losses) |
| Health Mapping | 5-tier classification | NDVI only | Visual estimate | None |
| Ganoderma Detection | 3-stage mapping | Not possible | Late stage only | Not detected |
| Prescription Maps | GPX + zone maps | Not available | Written notes | None |
| Certification Evidence | Audit-ready package | Insufficient | Partial | None |
| Annual Updates | Automatic archive | Re-purchase | Full resurvey | N/A |
The TFS Value
Domain Expertise
Built for palm oil — not generic agriculture. Every analysis parameter is calibrated for Malaysian plantation conditions.
RTK-Grade Precision
RTK positioning and tree-level precision mean your maps are accurate enough for legal, operational, and compliance use.
Your Timeline, Not Ours
5–7 day delivery from survey to complete report. Fly under clouds. No waiting for satellite revisit windows.
Annual Compounding
Each survey builds on the last. Change detection, trend analysis, and historical comparison get more valuable over time.
Packages by Estate Size
Pricing is based on your estate acreage — the bigger your estate, the more value per acre. Every package includes a complete aerial survey and full report.
Aerial Survey
From RM 15/acre
+ from RM 15/acre (rate varies by estate size)
One-off baseline — understand what you have
- ✓High-resolution aerial map
- ✓3D surface model & contour mapping
- ✓Tree count with tree-level precision
- ✓Yield estimation
- ✓Block boundary mapping
- ✓Full PDF report + 3D viewer
Plantation Intelligence
From RM 18/acre/quarter
+ mobilization & project setup fee
Complete estate health picture
- ✓Tree-level precision aerial survey
- ✓Canopy health assessment
- ✓Palm inventory & tree counts
- ✓Waterlogging & drainage maps
- ✓Weed coverage per block
- ✓Full PDF report + 3D viewer
Precision Management
Most PopularFrom RM 22/acre/quarter
+ mobilization & project setup fee
Know exactly what to do, where
- ✓Everything in Plantation Intelligence
- ✓Per-block prescription maps
- ✓Fertiliser & herbicide plans
- ✓GPS waypoints for ground crew
- ✓Ganoderma risk flagging
- ✓Printed A3 map + prescription card
RSPO/MSPO Certification Support
Add-on — from RM6–12/acre
Per-acre rate added on top of your existing tier
EUDR & MSPO documentation
- ✓Add to any package above
- ✓EUDR plot-level documentation
- ✓No-deforestation proof
- ✓MSPO audit-ready data
- ✓Supply chain traceability
- ✓Annual compliance certificate
Pricing is based on estate size and requirements. Contact us for a detailed quote →
See Your Numbers
Enter your estate size, slide the bars for each problem area, and see exactly how much income is at risk — and what a TFS drone survey would recover. Updates live.
Open ROI Calculator →Why Quarterly Monitoring?
Plantation management follows a natural cycle. A single survey gives you a snapshot — quarterly data gives you control. Fertiliser rounds, wet-season drainage, harvest-peak road conditions, and year-end replanting assessments all happen on different timelines. Quarterly flights capture each one.
Baseline & Planning
Initial aerial survey. Establish block boundaries, tree count, and estate baseline. Set priorities for the year ahead.
Health Assessment
First quarterly re-fly. Canopy health assessment, waterlogging check after wet season, early weed pressure detection.
Mid-Year Review
Second re-fly. Track changes since Q1, update prescription maps, assess road conditions before harvest peak.
Year-End & Replanting
Final quarterly survey. Replanting assessments, compliance documentation prep, annual performance summary report.
Quarterly monitoring is included in all Plantation Intelligence and Precision Management retainer plans. Each quarter builds on the last — giving you a living record of your estate over time.
Ready to See What Your Estate Is Missing?
Request a quote for your estate. We'll assess your requirements and provide a detailed proposal.